Interactive gm calculator — diode-connected MOSFET
Type in W, L, id, M and the estimator computes gm, ro, vov, vth and cg from the first-order model on this page (diode-connected → Vds=Vgs, saturation). Pick the model source, device type and voltage flavor below the device.
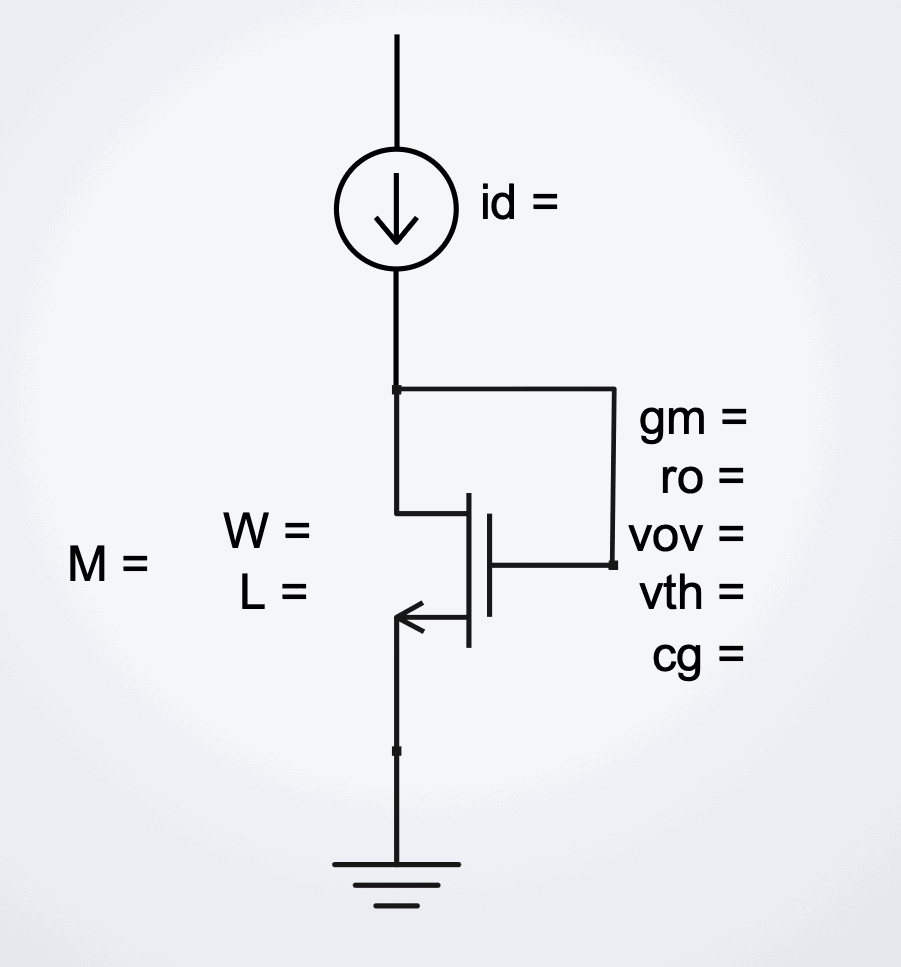
| at the op-point | sim (sky130) | est (formula) |
|---|---|---|
| gm | — | — |
| ro | — | — |
| vov | — | — |
| vth | — | — |
| cg | — | — |
1. The two equations
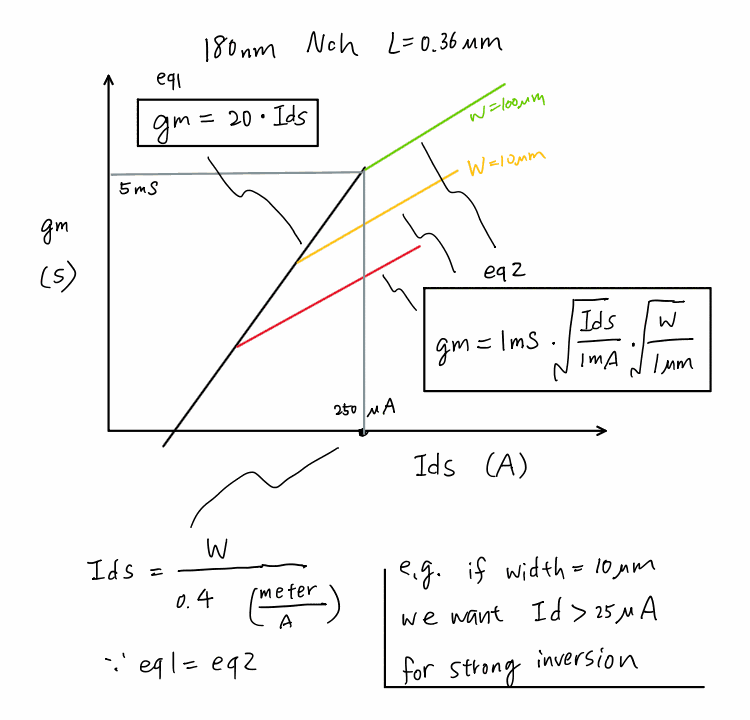
Two straight-line asymptotes bound the transconductance of a MOSFET as you sweep its drain current:
eq 1 — weak / moderate inversion (the "gm/Id" limit)
In weak inversion the transistor behaves like a bipolar: \(g_m\) is simply proportional to \(I_d\), and the slope \(\kappa\) is set almost entirely by physics and temperature (\(\phi_t=kT/q\approx26\,\text{mV}\), subthreshold factor \(n\approx1.2\text{–}1.5\)) — not by the process node. The sketch uses κ = 20.
eq 2 — strong inversion (the square-law)
Here \(g_m\propto\sqrt{I_d}\), and the coefficient carries the process through \(\mu_n C_{ox}\). Matching the sketch's 1 mS·√(I_d/1mA)·√(W/1µm) form at \(L=0.36\,\mu\text{m}\) pins down the process constant:
The corner — "how much current buys strong inversion"
Set eq 1 = eq 2. The two lines cross at:
Plugging the sketch's numbers (\(\mu_n C_{ox}=180\,\mu\text{A/V}^2,\ \kappa=20,\ L=0.36\,\mu\text{m}\)) gives a corner current density of 2.5 µA/µm — i.e. I_d = W / 0.4 with W in µm — exactly the "if W = 10 µm we want Id > 25 µA for strong inversion" note on the sketch. ✔
2. Live plot — gm vs Id
3. Reproduced with real sky130 data (ngspice)
Figure 2 is the first-order model. Here is the real thing — an ngspice DC sweep of the open-source SkyWater sky130_fd_pr__nfet_01v8 NMOS (L = 0.15 µm, Vds = 0.9 V, tt corner), with gm = dId/dVgs extracted at every step. Markers are sampled 4 per decade at 1 · 2.2 · 4.7 · 10, so they land evenly on the log axis. Deck + raw data in /spice.
Real weak-inversion slope κ = (gm/Id)max ≈ 29 S/A — higher than the sketch's 20, because sky130's subthreshold factor n ≈ 1.3. Each curve hugs the κ line at low current, then rolls into the √-law region as the device enters strong inversion — exactly the shape of the hand sketch, but every point here is a simulated device, not an equation.
4. The constants vs. process node
Only one of the two constants really moves with the node. κ is temperature-limited and stays ≈ 15–25 everywhere; the process story lives in μnCox (thinner oxide raises \(C_{ox}\), but scaled/strained channels change \(\mu_n\)) and therefore in the corner current density. The table below is seeded with rough textbook estimates — edit any cell to your PDK and both the chart and the plot update.
| Node | μnCox (µA/V²) | κ (S/A) | Lmin (µm) | eq2 coeff* (mS) | corner Id/W (µA/µm) |
|---|
gm=coeff·√(Id/1mA)·√(W/1µm), evaluated at that row's Lmin; equals \(\sqrt{2\mu_nC_{ox}\cdot(1\text{µm}/L_{min})\cdot1\text{mA}}\). Corner density uses L = Lmin.5. How to use this as a design shortcut
- Given a bias current, want max efficiency? Stay on the eq 1 line (weak/moderate inversion): \(g_m\approx\kappa I_d\) gives the most \(g_m\) per amp — great for low-power / low-noise front ends.
- Given a target gm and headroom, want speed? Push into strong inversion (eq 2). You pay current but gain \(f_T\) and matching.
- The corner is the design sweet spot. \(I_d/W = 2\mu_nC_{ox}/(\kappa^2 L)\) tells you the minimum current density for strong inversion. Below it you're wasting \(g_m\)/speed; far above it you're wasting power.